

Detailed Study Notes: Indian Economy – Historical Evolution to Present (UPSC EPFO Focus)
(Updated till November 2025; Data from IMF, NITI Aayog, World Bank, CMIE, MoSPI)
1. Overview of India’s Economic History
Historical Evolution and Key Phases
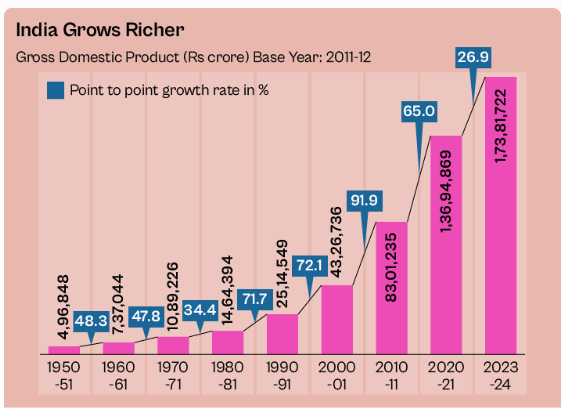
India’s economic journey reflects a cyclical saga of prosperity, colonial decline, and post-independence resurgence. From ancient trade civilizations to digital transformation, India’s economy showcases resilience and reform.
Ancient and Medieval Eras
- Indus Valley Civilization (3300–1300 BCE): Early urbanization and maritime trade with Mesopotamia (cotton exports, standardized weights).
- Mauryan Empire (300 BCE): Centralized administration, state monopolies in mining, and structured taxation.
- Mughal Period (1526–1707): India contributed 25–32% of global GDP, driven by agriculture and handicrafts (textiles, indigo, spices).
Colonial Period (1757–1947)
- The Battle of Plassey (1757) marked the onset of colonial exploitation by the East India Company.
- Deindustrialization: India’s textile export share dropped from 25% (1700) to below 2% (1900).
- Drain of Wealth Theory (Dadabhai Naoroji): Estimated transfer of ~$45 trillion in modern terms.
- Famines: Bengal Famine (1943) killed over 3 million.
- Stagnation: Per capita income grew just 0.9% annually (1870–1947).
Post-Independence: Mixed Economy Phase (1947–1991)
- Adopted Industrial Policy Resolution (1948) → Mixed economy with public sector dominance and central planning (Five-Year Plans).
- Growth averaged 3–3.5% (“Hindu Rate of Growth”), focusing on import substitution, heavy industries, and agricultural self-sufficiency.
- Achievements: IITs, Green Revolution (1960s), infrastructure base.
Reform Era (1991–2014)
- 1991 BoP Crisis: Fiscal deficit 9.4%, reserves $1.06 billion.
- LPG Reforms (Liberalization–Privatization–Globalization): Tariffs cut (300% → 30%), de-licensing, FDI inflows.
- Result: Growth accelerated to 6–8%, middle-class expansion, IT boom, and export surge.
Modern Era (2014–2025)
- Reforms: GST (2017), IBC (2016), PLI Schemes, Digital India, and Make in India.
- GDP (Nominal, 2025): $4.13 trillion (4th largest); PPP $17.71 trillion.
- IMF FY2025–26 growth projection: 6.6%, outperforming China (4.1%) and the US (1.8%).
- Forex Reserves: ~$700 billion (Nov 2025).
Extended Economic Timeline
| Period | Key Features | Global GDP Share / Growth | Major Policies / Impacts |
|---|---|---|---|
| Ancient (Pre–1000 CE) | Prosperous agrarian & trade hubs (Silk Route). | ~30% (1 CE) | Innovation in metallurgy, Gupta prosperity. |
| Medieval (1000–1700) | Mughal artisan economy, export-led growth. | 25–32% | Land revenue (Zabt); trade surplus. |
| Colonial (1757–1947) | Deindustrialization, railways for extraction. | Fell to 3% (1947) | Drain of wealth, famines, impoverishment. |
| Post-Independence (1947–1991) | Five-Year Plans, PSUs, protectionism. | 3–3.5% | Green Revolution; import substitution. |
| Reform Era (1991–2014) | LPG, IT boom, FDI inflows. | 5–6% | Poverty fell from 45% → 22%. |
| Modern (2014–2025) | GST, Digital Push, Make in India. | 6–7% avg.; 3.5% global share | Resilience post-COVID; Viksit Bharat Vision. |
Case Study: 1991 Crisis → 2025 Boom
- Then (1991): Reserves $1 bn; 17% inflation; fiscal deficit 9.4%.
- Now (2025): Exports $800 bn; forex $700 bn; 171 mn lifted from poverty (2011–2023).
- Demonstrates reform-led transformation and poverty-employment linkage.
Analytical Insight (UPSC-Relevant)
2. Sectors of the Indian Economy
Structural Transformation (Lewis Model)
- According to Arthur Lewis’s Dual-Sector Model, labor moves from low-productivity agriculture to higher-productivity industry/services.
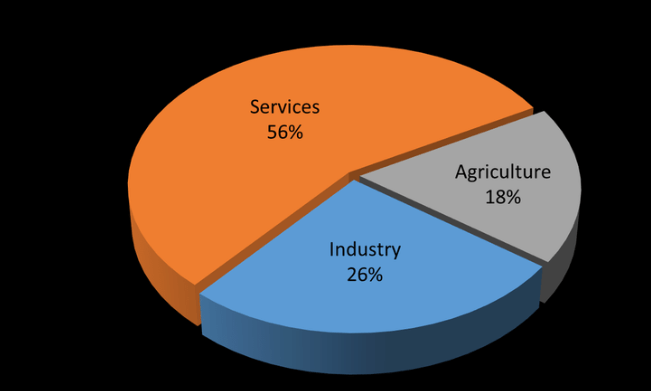
- In India, agriculture’s GDP share fell from 55% (1950s) to 17.9% (2024–25), yet it employs 42% of the workforce → disguised unemployment.
Latest Sectoral Data (Q1 FY2025–26; MoSPI/NSO)
| Sector | GDP Share (%) 2024–25 | Workforce Share (%) | Q1 FY25–26 Growth (%) | Key Features |
|---|---|---|---|---|
| Primary (Agri, Forestry, Fishing, Mining) | 17.9 | 42 | 3.8 | Climate risks; PM-KISAN aids 12 cr farmers; dairy growth 5%. |
| Secondary (Manufacturing, Construction, Utilities) | 27.1 | 25 | 7.5 | PLI boosts FDI ($30 bn); EVs 10% market share; infra expansion. |
| Tertiary (Services: IT, Finance, Trade, Transport) | 55 | 33 | 8.2 | IT exports $300 bn; UPI 15 bn txn/month; fintech boom. |
Total Nominal GDP (FY2024–25): ₹330 lakh crore.
Real GDP (Q1 FY2025–26): ₹47.89 lakh crore.
Subsector Highlights
- Agriculture: GVA ₹30 lakh crore; productivity low (₹1.5 lakh/farmer/year); Green Revolution II under discussion.
- Manufacturing: PLI across 14 sectors; mobile output tripled to $50 bn.
- Services: 55% GDP share; contributes ≈4.5% to total GDP growth (55% × 8.2%).
Analytical Note:
India’s services-led growth drives GDP but not jobs → “jobless growth” paradox.
3. Features of the Indian Economy (2025)
| Category | Feature / Data (Nov 2025) |
|---|---|
| Demographics | 65% population under 35; dependency ratio 48%. |
| Urbanization | 36% urban; 100 Smart Cities; ₹2 lakh crore invested. |
| Digital Leap | 1.2 bn Aadhaar-linked users; fintech = 80% digital transactions. |
| Innovation | 1.3 lakh startups; 140 unicorns; GII rank 39 (2025). |
| FDI & Trade | FDI $80 bn (2024–25); exports $800 bn. |
| Sustainability | 200 GW renewables; EV sales 2 mn; Green GDP in focus. |
| Human Development | HDI 0.645; per capita income $2,697. |
Insight:
India’s mixed, digitalized economy fosters growth but risks widening inequality.
4. Major Concerns (2025)
| Issue | Current Status / Data (Nov 2025) | Implications |
|---|---|---|
| Unemployment | 5.2% (PLFS), 7.49% (CMIE); youth 15%; female LFPR 33%. | Jobless growth; skill mismatch. |
| Inflation | CPI 4–5%; food inflation 6%. | Hits poor households hardest. |
| Fiscal Stress | Debt 82.6% of GDP; deficit 5.1%. | Limits social spending. |
| Inequality | Gini 0.35; top 1% own 40% wealth. | Weakens inclusive growth. |
| External Risks | CAD 1–2%; US tariff shocks; floods cost 1% GDP annually. | Global exposure; climate vulnerability. |
5. Underdevelopment in India
Root Causes
- Colonial legacy: Deindustrialization, extractive institutions.
- Population pressure: 1.46 bn (growth 0.8%).
- Low capital formation: 31% of GDP; R&D only 0.7%.
- Social constraints: Caste, gender, and education gaps.
Cycle of Underdevelopment:
Low Income → Poor Education/Health → Low Productivity → Low Income.
(Break via human capital investment and rural skill programs.)
Indicators (2025):
- Per capita income: $2,697
- MPI: ~10% population multidimensionally poor
- HDI rank: 134 (UNDP 2024)
6. Economic Planning in India
Pre-Independence Blueprints
| Plan | Year / Author | Ideology |
|---|---|---|
| National Planning Committee | 1938 – Nehru | Socialist; heavy industry focus. |
| Bombay Plan | 1944 – Tata, Birla | Capitalist; infrastructure-led. |
| People’s Plan | 1945 – M.N. Roy | Labor-centric; egalitarian. |
| Gandhian Plan | 1944 – Shriman Narayan | Village-based self-reliance. |
Post-Independence (1951–2017)
- 1st Plan (1951–56):
Harrod–Domar Model (g = s/v);
achieved 3.6% growth vs. 2.1% target. - 2nd Plan: Mahalanobis heavy-industry focus.
- 5th Plan: Garibi Hatao (poverty removal).
- 11th Plan: Inclusive growth (2007–12).
- Outcome: GDP tripled; life expectancy 32 → 70 years.
- Shift (2015): NITI Aayog replaced Planning Commission for flexibility.
7. Economic Reforms
1991 LPG Reforms
- Triggers: BoP crisis; high deficit; IMF conditions.
- Components:
- Liberalization: De-licensing, reduced tariffs.
- Privatization: PSU disinvestment.
- Globalization: FDI openness (100% in 26 sectors).
- Impact: Growth ↑ to 7%; poverty ↓; inequality ↑.
Post-2014 Structural Reforms
- GST (2017): Unified indirect tax; ₹2 lakh crore/month revenue.
- IBC (2016): Cleared ₹3 lakh crore NPAs.
- PLI (2020): Boosted manufacturing & FDI inflows.
8. NITI Aayog (2015–Present)
| Aspect | Details (as of 2025) |
|---|---|
| Structure | PM as Chair; CEO: Amitabh Kant (till 2025). |
| Functions | Think-tank for cooperative federalism; SDG monitoring; innovation promotion. |
| Key Reports (Nov 2025) | SDG India Index 2023–24 (National Score: 71); Global SDR 2025 Rank: 99 (Score 67); Viksit Bharat@2047 roadmap. |
| Achievements | 269 mn lifted from MPI poverty (2015–2023); AIM: 10k innovation labs. |
| Challenges | Implementation gaps, state capacity issues. |
Practice Section
Key Formulas
- CAGR: [(End Value / Start Value)^{1/n} – 1] × 100
- Harrod–Domar: g = s/v
- Unemployment Rate: (Unemployed ÷ Labor Force) × 100
UPSC-Style MCQs
- India’s projected GDP growth (FY2025–26, IMF Nov 2025):
(B) 6.6% - Sector contributing ~55% to GDP (2024–25):
(C) Tertiary - CMIE Unemployment Rate (Oct 2025):
(B) 7.49% - NITI SDG India Index 2023–24 score:
(B) 71 - Harrod–Domar model formula:
(A) g = s/v

Leave a comment