

Measurement of Growth in Economics
Measurement of growth refers to the ways economists quantify the expansion of an economy’s productive capacity and output over time. Key concepts include the circular flow of income, Gross Domestic Product (GDP), macroeconomic identities, distinctions between growth, welfare, and development, and market structures that influence economic behavior. These elements help assess an economy’s performance and inform policy decisions. Below, each topic is explained in detail.
Circular Flow of Income
The circular flow of income is an economic model that illustrates how money, goods, services, and resources circulate through an economy in a continuous loop. It highlights the interdependence between different sectors, showing how income generated from production is spent and reinvested.
- Basic Two-Sector Model: This involves households and firms. Households provide factors of production (like labor, land, capital, and entrepreneurship) to firms in exchange for income (wages, rent, interest, and profits). Firms use these factors to produce goods and services, which they sell back to households. Households then spend their income on these goods and services, completing the cycle.
- Expanded Models: More complex versions include the government sector (which collects taxes and provides public goods) and the foreign sector (involving exports and imports). Leakages (savings, taxes, imports) and injections (investments, government spending, exports) can disrupt or boost the flow.
- Significance: This model helps explain national income accounting and how economic activity sustains itself. For instance, an increase in household spending can lead to higher production and income.

Gross Domestic Product (GDP)
GDP is the total monetary value of all final goods and services produced within a country’s borders over a specific period, typically a year or quarter. It serves as a primary indicator of economic health and growth.
- Types of GDP:
- Nominal GDP: Measured at current market prices, without adjusting for inflation.
- Real GDP: Adjusted for inflation to reflect true changes in output volume.
- GDP per Capita: GDP divided by population, indicating average economic output per person.
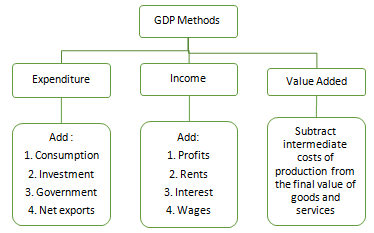
- Measurement Methods: GDP can be calculated in three equivalent ways, which should yield the same result:
- Expenditure Approach: Adds up total spending: Consumption (C) + Investment (I) + Government Spending (G) + Net Exports (X – M).
- Income Approach: Sums all incomes earned: Wages + Rents + Interest + Profits.
- Production (Value-Added) Approach: Measures the value added at each stage of production, subtracting intermediate costs to avoid double-counting.
- Limitations: GDP doesn’t account for non-market activities (e.g., household work), environmental degradation, or income inequality.
Macroeconomic Identities
Macroeconomic identities are fundamental equations that describe relationships between key economic variables and must always hold true by definition. They provide a framework for understanding how different parts of the economy balance out.
- Key Examples:
- National Income Identity (Expenditure Approach): Y = C + I + G + (X – M), where Y is total output (GDP), C is consumption, I is investment, G is government spending, X is exports, and M is imports.
- Savings-Investment Identity: In a closed economy, savings (S) equals investment (I). In an open economy, it expands to S + (T – G) + (M – X) = I, where T is taxes.
- Disposable Income Identity: Yd = Y – T + TR, where Yd is disposable income, T is taxes, and TR is transfers (e.g., subsidies).
- Other Identities: Include those related to GNP (Gross National Product = GDP + net income from abroad) and NNP (Net National Product = GNP – depreciation).
- Purpose: These identities help analyze economic equilibrium, fiscal policy impacts, and imbalances like trade deficits.
Growth, Welfare, and Development
These terms are related but distinct concepts in economics, focusing on different aspects of societal progress.
- Economic Growth: Refers to an increase in the economy’s productive capacity, typically measured by rising real GDP or GDP per capita over time. It’s quantitative and focuses on output expansion, often driven by factors like capital accumulation, technological advancement, and labor force growth.
- Welfare: Encompasses overall well-being and quality of life, beyond just income. It includes elements like health, education, inequality reduction, and environmental sustainability. Growth doesn’t always translate to welfare; for example, pollution from industrialization might harm welfare despite boosting GDP.
- Development: A broader, long-term process involving structural changes that improve living standards, reduce poverty, and enhance human capabilities. It’s qualitative and often measured by indices like the Human Development Index (HDI), which combines income, life expectancy, and education.
- Differences: Growth is narrow and GDP-focused, while welfare and development are holistic. For instance, a country might experience high growth but low development if inequality persists. Alternatives to GDP for measuring these include the Better Life Index or Genuine Progress Indicator.
Market Structures
Market structures describe how firms and industries are organized based on competition levels, influencing pricing, output, and efficiency. They range from highly competitive to monopolistic, affecting economic growth through innovation and resource allocation.
| Structure | Key Features | Number of Firms | Examples |
|---|---|---|---|
| Perfect Competition | Homogeneous products, perfect information, free entry/exit, price takers. Firms earn normal profits in the long run. | Many (e.g., 100% of market shared equally) | Agricultural markets like wheat farming. |
| Monopolistic Competition | Differentiated products (e.g., branding), low barriers to entry, some price control. | Many, but with product variety | Restaurants, clothing brands. |
| Oligopoly | Interdependent firms, barriers to entry, potential for collusion. Prices often stable due to strategic behavior. | Few (e.g., 5-firm concentration >50%) | Automobile industry (e.g., Toyota, Ford). |
| Monopoly | Single seller, high barriers to entry (e.g., patents), price makers. Can earn supernormal profits. | One (at least 25% market share) | Utilities like local electricity providers. |
Implications for Growth: Competitive structures encourage efficiency and innovation, while monopolies might lead to higher prices but also R&D investment.
1. Circular Flow of Income
- In the two-sector model of circular flow of income, which of the following represents a leakage?
- A) Household consumption expenditure
- B) Firm investment in capital goods
- C) Savings by households
- D) Factor payments from firms to households
- Consider the four-sector model. If exports exceed imports, it acts as:
- A) A leakage in the circular flow
- B) An injection in the circular flow
- C) Neither leakage nor injection
- D) A reduction in government spending
- In the context of India’s economy, remittances from NRIs primarily function as:
- A) A leakage in the foreign sector
- B) An injection via net exports
- C) A tax revenue for the government
- D) A depreciation adjustment in national income
- The equilibrium condition in the circular flow model implies:
- A) Leakages > Injections
- B) Injections = Leakages
- C) Total output < Total expenditure
- D) Savings > Investment
- Which sector’s addition to the two-sector model introduces taxes as a leakage and government spending as an injection?
- A) Foreign sector
- B) Financial sector
- C) Government sector
- D) Informal sector
Answers and Explanations:
- C) Savings by households – Savings withdraw money from the flow, acting as a leakage.
- B) An injection in the circular flow – Net exports (X > M) bring money into the economy.
- B) An injection via net exports – Remittances are part of NFIA, boosting income flow.
- B) Injections = Leakages – This balances the flow for equilibrium.
- C) Government sector – Taxes leak, while G injects.
2. GDP (Gross Domestic Product)
- Which method of GDP calculation avoids double-counting by subtracting intermediate consumption?
- A) Income method
- B) Expenditure method
- C) Production (Value-Added) method
- D) Deflator method
- In India’s national accounts, the base year for real GDP calculation as of 2025 is:
- A) 2004-05
- B) 2011-12
- C) 2015-16
- D) 2020-21
- If nominal GDP is ₹300 lakh crore and the GDP deflator is 120, what is the real GDP (in ₹ lakh crore)?
- A) 250
- B) 360
- C) 240
- D) 300
- Which component of GDP by expenditure method is typically the largest in India (around 58-60%)?
- A) Government Final Consumption Expenditure (GFCE)
- B) Private Final Consumption Expenditure (PFCE)
- C) Gross Fixed Capital Formation (GFCF)
- D) Net Exports (NX)
- GDP at factor cost differs from GDP at market price by:
- A) Adding depreciation
- B) Subtracting net indirect taxes
- C) Adding net factor income from abroad
- D) Subtracting subsidies
Answers and Explanations:
- C) Production (Value-Added) method – It uses GVA to avoid counting inputs multiple times.
- B) 2011-12 – This is the current base year for India’s GDP series.
- A) 250 – Real GDP = Nominal GDP / (Deflator/100) = 300 / 1.2 = 250.
- B) Private Final Consumption Expenditure (PFCE) – It dominates India’s consumption-driven economy.
- B) Subtracting net indirect taxes – Factor cost = Market price – (Taxes – Subsidies).
3. Macroeconomic Identities
- In an open economy with government, the savings-investment identity is:
- A) S = I
- B) S = I + (G – T) + (X – M)
- C) S + (T – G) = I + (X – M)
- D) S = I + NX
- GNP exceeds GDP when:
- A) Depreciation is positive
- B) Net Factor Income from Abroad (NFIA) is positive
- C) Indirect taxes exceed subsidies
- D) Imports exceed exports
- National Income is equivalent to:
- A) GDP at market price
- B) NNP at factor cost
- C) NDP at market price
- D) GNP at factor cost
- In India’s context, a positive NFIA is largely due to:
- A) High exports of goods
- B) Remittances from abroad
- C) Foreign direct investment outflows
- D) Depreciation of capital
- If Y = C + I + G + NX, rearranging for the twin deficits shows:
- A) (G – T) = (S – I) – NX
- B) (S – I) = (G – T) + NX
- C) NX = (S – I) + (G – T)
- D) I = S + (T – G) + NX
Answers and Explanations:
- C) S + (T – G) = I + (X – M) – This balances private, public, and external sectors.
- B) Net Factor Income from Abroad (NFIA) is positive – GNP = GDP + NFIA.
- B) NNP at factor cost – It represents net income available after depreciation and adjustments.
- B) Remittances from abroad – India receives ~$100 billion annually.
- D) I = S + (T – G) + NX – Derived from the basic identity, showing funding sources for investment.
4. Growth, Welfare, and Development
- Economic growth is primarily measured by:
- A) Human Development Index (HDI)
- B) Gini Coefficient
- C) GDP growth rate
- D) Multidimensional Poverty Index (MPI)
- Which of the following is NOT a component of HDI?
- A) Life expectancy at birth
- B) Mean years of schooling
- C) Gross National Income per capita (PPP)
- D) Environmental sustainability index
- In India, high GDP growth but medium HDI ranking indicates:
- A) Strong welfare but weak development
- B) Growth without adequate welfare and development
- C) Balanced growth and welfare
- D) Low inequality
- Welfare measurement focuses on:
- A) Quantitative output increase
- B) Distribution and well-being aspects like health and education
- C) Sustainable environmental practices only
- D) Per capita income alone
- Amartya Sen’s capability approach emphasizes:
- A) GDP as the sole measure of development
- B) Freedoms and capabilities over mere income
- C) Trickle-down economics
- D) Nominal growth rates
Answers and Explanations:
- C) GDP growth rate – It quantifies output increase.
- D) Environmental sustainability index – HDI includes life, education, and income.
- B) Growth without adequate welfare and development – India’s HDI rank (134 in 2022) lags growth.
- B) Distribution and well-being aspects like health and education – Beyond money metrics.
- B) Freedoms and capabilities over mere income – Focuses on what people can achieve.
5. Market Structures
- In perfect competition, firms are:
- A) Price makers with high barriers
- B) Price takers with no barriers to entry
- C) Interdependent in pricing
- D) Differentiated product sellers
- Which market structure is characterized by a kinked demand curve?
- A) Monopoly
- B) Monopolistic competition
- C) Oligopoly
- D) Perfect competition
- In India, the telecom sector (e.g., Jio, Airtel) is an example of:
- A) Perfect competition
- B) Monopoly
- C) Oligopoly
- D) Monopolistic competition
- Long-run economic profits are zero in:
- A) Monopoly and oligopoly
- B) Perfect competition and monopolistic competition
- C) Oligopoly only
- D) Monopoly only
- The Competition Commission of India (CCI) primarily regulates:
- A) Perfectly competitive markets
- B) Anti-competitive practices like cartels in oligopolies
- C) Government monopolies
- D) Informal sector structures
Answers and Explanations:
- B) Price takers with no barriers to entry – Many sellers, homogeneous products.
- C) Oligopoly – Reflects price rigidity due to interdependence.
- C) Oligopoly – Few dominant players with high barriers.
- B) Perfect competition and monopolistic competition – Entry erodes profits.
- B) Anti-competitive practices like cartels in oligopolies – E.g., fines on cement companies.

Leave a comment