

1. Types of Poverty
Conceptual Framework
Poverty refers to the inability to meet basic needs — food, shelter, clothing, healthcare, and education — due to insufficient resources. It is multidimensional, encompassing social exclusion, lack of opportunities, and deprivation of dignity.
Poverty alleviation policies aim to break the cycle of deprivation, often linked with employment generation, education, and skill enhancement.
Classification of Poverty
| Type | Description | Causes / Characteristics | Examples in India |
|---|---|---|---|
| Absolute Poverty | Inability to afford basic necessities below a fixed threshold; measured via income or consumption. | Low income, lack of assets, natural disasters. | Rural poor below ₹32/day (as per Tendulkar line). |
| Relative Poverty | Having significantly less income than the societal average; leads to exclusion and inequality. | Income disparity, social stratification. | Urban poor in metros unable to afford housing. |
| Situational Poverty | Temporary poverty due to unexpected events; often reversible. | Job loss, illness, natural calamities. | Farmers affected by 2024 monsoon failures in Bihar. |
| Generational Poverty | Poverty persisting across generations due to systemic barriers. | Lack of education, caste discrimination, inherited debt. | Marginalized communities with low mobility. |
| Rural Poverty | Dominant in agricultural areas; linked to low productivity and monsoon dependency. | Landlessness, underemployment, migration. | Small farmers in Eastern UP or Bihar. |
| Urban Poverty | Exists in cities; associated with slums, informal jobs, and inadequate housing. | High cost of living, unemployment, migration. | Slum dwellers in Mumbai or Delhi. |
Cycle of Poverty
Poverty perpetuates itself through a vicious cycle:
Low Income → Poor Education/Health → Low Productivity → Continued Poverty.
Breaking the cycle requires state intervention through skill training, credit access, and social protection schemes.
(Diagram Suggestion): A circular flowchart showing low income leading to poor education and health, resulting in low productivity and looping back to low income. Arrows showing government intervention points (education, skill, subsidies).
Indian Context
India exhibits a mixed pattern of poverty — absolute poverty in rural regions and relative poverty driven by rising inequality (Gini Coefficient ~0.35).
Post-COVID, situational poverty spiked due to large-scale job losses and reverse migration.
Policy Implication:
- Absolute poverty → Cash transfer schemes like PM-KISAN, PM Garib Kalyan Yojana.
- Relative poverty → Structural reforms and progressive taxation to reduce inequality.
2. Measurement of Poverty
Overview
Measurement of poverty enables targeted interventions and resource allocation. Over time, the approach evolved from income-based measures to multidimensional indices capturing health, education, and living standards.
Key Methods
- Headcount Ratio (HCR)
[
H = \frac{q}{n} \times 100
]
Where q = number of poor, n = total population.- Measures incidence of poverty but ignores intensity.
- Poverty Gap Index (PGI)
[
PGI = \frac{1}{n} \sum \left(\frac{PL – Y_i}{PL}\right)
]
Measures average shortfall from the poverty line, indicating depth. - Squared Poverty Gap (SPG)
[
SPG = \frac{1}{n} \sum \left(\frac{PL – Y_i}{PL}\right)^2
]
Assigns higher weight to the poorest of the poor. - Multidimensional Poverty Index (MPI) – UNDP & Oxford
[
MPI = H \times A
]
Where H = incidence, A = average intensity.
Dimensions:- Health: Nutrition, child mortality
- Education: Schooling, years of education
- Living Standards: Electricity, sanitation, water, assets
Poverty Lines in India
| Committee | Year | Criteria / Methodology | Poverty Line (Monthly per capita) |
|---|---|---|---|
| Tendulkar Committee | 2009 | Consumption-based, mixed recall period | ₹816 (Rural), ₹1,000 (Urban) |
| Rangarajan Committee | 2014 | Broader basket of goods, higher thresholds | ₹972 (Rural), ₹1,407 (Urban) |
| Current Practice | – | NITI Aayog uses MPI; World Bank uses $2.15/day (extreme) and $3.65/day (lower-middle). | – |
Limitations
- Static nature (ignores poverty dynamics).
- Regional variations in cost of living.
- Underestimation of urban informal poverty.
Indian Context Example:
Earlier calorie-based norms (2400 kcal rural, 2100 kcal urban) are now replaced by multidimensional assessment.
3. SDGs Related to Poverty and Employment
Overview
The UN Sustainable Development Goals (2015–2030) provide a global framework for inclusive growth. Two goals directly relate to this topic:
- SDG 1: No Poverty
- SDG 8: Decent Work and Economic Growth
India aligns its progress through NITI Aayog’s SDG India Index.
SDG 1: No Poverty
- Targets:
- End extreme poverty ($2.15/day).
- Halve national poverty.
- Expand social protection and ensure equal access to resources.
- India’s Progress (2025):
- 269 million lifted out of poverty (2015–2023).
- Extreme poverty reduced to ~5.3% (World Bank, 2022-23).
- Persistent regional disparities (Bihar, Jharkhand lagging).
SDG 8: Decent Work and Economic Growth
- Targets:
- Achieve full and productive employment.
- Reduce youth NEET (Not in Education, Employment, or Training).
- Eradicate forced labour and promote entrepreneurship.
- India’s Performance:
- ~17 crore jobs added (2020–2025).
- GDP growth: ~6.6% (2025–26 projection).
- Informal employment remains high (~80%).
Linkages Between SDG 1 & 8
Employment generation acts as a direct pathway to poverty reduction.
Schemes like Skill India, PMEGP, and Start-Up India serve both SDG 1 and SDG 8 objectives.
4. Types of Unemployment
Conceptual Understanding
Unemployment occurs when people willing to work at prevailing wages cannot find jobs. It leads to income loss, inequality, and poverty persistence.
Types of Unemployment
| Type | Description | Causes | Examples in India |
|---|---|---|---|
| Frictional | Short-term, between jobs. | Job search, transition. | Fresh graduates seeking jobs. |
| Structural | Skill mismatch between workers and jobs. | Technological changes, globalization. | Textile workers replaced by machines. |
| Cyclical | Linked to economic recessions. | Demand deficiency, investment fall. | Job losses in hospitality post-COVID. |
| Seasonal | Varies by season/industry. | Agricultural cycles, tourism. | Farm workers unemployed post-harvest. |
| Disguised | Hidden unemployment; zero marginal productivity. | Overstaffing, low productivity. | Family labour on small farms. |
| Technological | Caused by automation and AI. | Mechanization, Industry 4.0. | Factory automation displacing labour. |
| Voluntary | By choice; waiting for better jobs. | High reservation wages. | Educated youth delaying employment. |
Measurement (India)
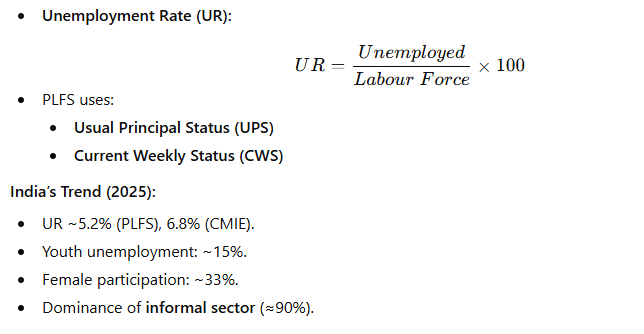
5. Current Status in India (2025)
Poverty
- Extreme Poverty: ~5.3% (World Bank, 2022–23).
- Multidimensional Poverty: 269 million lifted (2015–23).
- Regional Disparities: Bihar (~20%) vs. Kerala (<1%).
- Flagship Interventions:
- MGNREGA (100 days work)
- PM Awas Yojana (housing)
- Jan Dhan Yojana (financial inclusion)
- Aspirational Districts Programme (multidimensional targeting)
Employment
- Unemployment Rate: 5–6% (average).
- Employment Growth: +17 crore jobs (2019–2025).
- Key Challenges: Informality, automation, skill mismatch.
- Policy Focus:
- Atmanirbhar Bharat – promotes local enterprise.
- Skill India Mission – training 1 crore youth.
- Startup India – innovation-driven job creation.
Interconnections
- Unemployment aggravates poverty, especially in urban slums and rural distress zones.
- Integrated Approaches:
- NRLM and Self-Help Groups (SHGs) for self-employment.
- MGNREGA for wage employment.
- PMEGP for micro-entrepreneurship.
Additional Resources and Practice
Glossary
- PL: Poverty Line
- NEET: Not in Education, Employment, or Training
- MPI: Multidimensional Poverty Index
Practice
- Calculate Headcount Ratio and Poverty Gap using sample data.
- Analyze India’s progress on SDG 1 & 8 from NITI Aayog’s latest reports.
Recommended Readings
- Indian Economy – Ramesh Singh
- NITI Aayog Reports on SDGs (2023–24)
- World Bank: Poverty & Equity Brief (India, 2025)

Leave a comment