
1. Concept of Elasticity of Demand
Overview
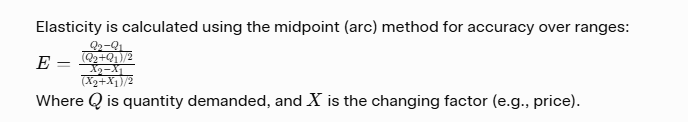
Elasticity of demand is a measure of how sensitive the quantity demanded of a good or service is to a change in one of its determinants, such as price, income, or the price of related goods. It quantifies the percentage change in quantity demanded relative to a percentage change in the determinant. This concept helps predict consumer behavior, business pricing strategies, and policy impacts (e.g., taxes).
Elasticity is always expressed as an absolute value (positive number) for interpretation, though the sign can indicate direction in some types. Key interpretations:
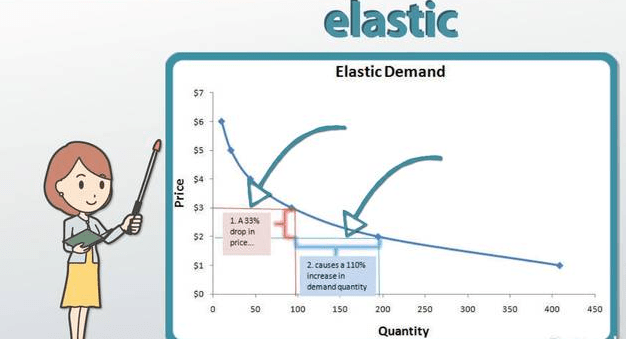
- Elastic (>1): Quantity demanded changes more than proportionally to the factor (highly responsive).
- Inelastic (<1): Quantity demanded changes less than proportionally (less responsive).
- Unitary (=1): Proportional change.
- Perfectly elastic (∞): Infinite response (horizontal demand curve).
- Perfectly inelastic (0): No response (vertical demand curve).
Why It Matters
Elasticity explains why some price changes lead to big sales drops (e.g., luxury goods) while others don’t (e.g., essentials). It’s crucial in microeconomics for revenue optimization and in macroeconomics for aggregate demand analysis.
Examples
- If a 10% price increase for coffee leads to a 15% drop in quantity demanded, demand is elastic (E = 1.5).
- For insulin, a 10% price hike might cause only a 2% drop (E = 0.2, inelastic).
Review Questions
- What does an elasticity value greater than 1 indicate?
- Explain the midpoint formula for elasticity with a simple example.
2. Factors Affecting Elasticity of Demand
Key Determinants
Several factors influence how elastic demand is for a good. These don’t “shift” elasticity directly but determine the steepness or flatness of the demand curve.
Use the table below for a summary:
| Factor | Description | Example | Effect on Elasticity |
|---|---|---|---|
| Availability of Substitutes | More substitutes make it easier to switch, increasing responsiveness. | Soft drinks (many brands) | Increases (more elastic) |
| Necessity vs. Luxury | Essentials are less responsive; luxuries are more. | Salt (necessity) vs. jewelry | Necessities: inelastic; Luxuries: elastic |
| Proportion of Income | Goods taking a large budget share are more sensitive to price changes. | Housing (large share) | Increases (more elastic) |
| Time Horizon | Short run: less time to adjust (inelastic); Long run: more alternatives (elastic). | Gasoline (short: inelastic) | Long run: more elastic |
| Definition of Market | Narrowly defined goods (e.g., “Pepsi”) have more substitutes than broad categories (e.g., “beverages”). | Specific brand vs. category | Narrow: more elastic |
| Habits/Addiction | Addictive goods are less responsive. | Cigarettes | Decreases (more inelastic) |
Detailed Explanation
- Substitutes: If close alternatives exist, consumers can easily switch, making demand elastic (e.g., butter vs. margarine).
- Time: Over time, consumers find alternatives or adjust habits, increasing elasticity.
- These factors help firms decide pricing: Elastic goods require cautious price hikes to avoid revenue loss.
Examples
- Demand for air travel is elastic in the long run due to alternatives like trains or video calls.
- Prescription drugs are often inelastic due to necessity and few substitutes.
Review Questions
- Why is demand for luxuries typically more elastic than for necessities?
- How does the time horizon affect elasticity? Provide an example.
3. Shifts in Demand vs. Elasticity
Clarification
Elasticity relates to movements along the demand curve (responsiveness to price changes), not shifts of the curve itself. Shifts in demand occur due to non-price factors (e.g., income, tastes), changing the entire curve left or right. However, elasticity influences how a shift affects equilibrium or revenue.
Key Distinctions
- Movement Along the Curve: Caused by price changes; elasticity measures the magnitude of quantity response.
- Shift of the Curve: Caused by determinants like income or preferences; this changes demand at every price, but the elasticity (slope) of the new curve may differ based on factors above.
- Elasticity doesn’t cause shifts, but a more elastic demand means larger quantity changes for the same price adjustment after a shift.
Graphical Insight
A shift right in demand (e.g., due to higher income) on an elastic curve leads to a smaller price increase but larger quantity increase compared to an inelastic curve.
Examples
- If tastes shift demand for electric cars right, elastic demand (many substitutes) results in moderate price rises but big sales jumps.
- Inelastic demand (few substitutes) would cause sharper price increases.
Review Questions
- Differentiate between a shift in demand and a movement along the demand curve in the context of elasticity.
- How might elasticity affect the outcome of a demand shift?
4. Price Elasticity of Demand (PED)
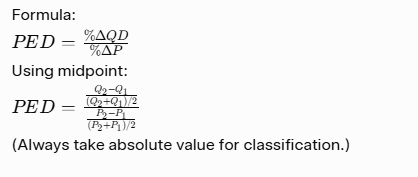
Definition and Formula
Price elasticity of demand (PED)
Interpretations
- Elastic (>1): Revenue falls with price increase (e.g., movie tickets).
- Inelastic (<1): Revenue rises with price increase (e.g., salt).
- Unitary (=1): Revenue unchanged.
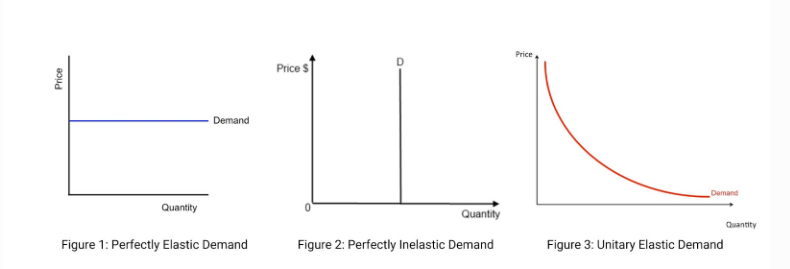
Elasticity of Demand and its Types – Price, Income and Cross …
This diagram shows perfectly elastic (horizontal), inelastic (vertical), and unitary (hyperbolic) demand curves.
Calculation Example
Initial: P1 = $10,
Q1 = 100.
New: P2 = $12, Q2 = 80. %
ΔQD = (80-100)/((80+100)/2) = (-20)/90 ≈ -22.2%
% ΔP = (12-10)/((12+10)/2) = 2/11 ≈ 18.2%
PED = | -22.2% / 18.2% | ≈ 1.22 (elastic).
To arrive: Calculate percentage changes using midpoints, divide, take absolute value.
Graphical Representation
Steeper curve = more inelastic; flatter = more elastic.
Price Elasticity of Demand | Definition, Formula & Examples Video
Review Questions
- If PED is 0.5, what happens to revenue if price increases?
- Calculate PED if price drops from $5 to $4, and quantity rises from 200 to 250. Explain steps.
5. Cross-Price Elasticity of Demand (CPED)
Definition and Formula
Cross-price elasticity of demand (CPED) measures responsiveness of quantity demanded for one good to a price change in another good. Formula: CPED=%ΔQDA%ΔPB CPED = \frac{\% \Delta QD_A}{\% \Delta P_B} CPED=%ΔPB%ΔQDA Sign matters: Positive = substitutes; Negative = complements; Zero = unrelated.
Interpretations
- Positive (>0): Substitutes (e.g., tea and coffee).
- Negative (<0): Complements (e.g., cars and gasoline).
- Magnitude: >1 elastic cross-response; <1 inelastic.
Calculation Example
Coffee price rises 10%, tea demand rises 15%: CPED = 15%/10% = 1.5 (substitutes, elastic). To arrive: Use percentage changes; positive sign indicates substitution.
Examples
- Butter price up → Margarine demand up (positive CPED).
- Printer price down → Ink demand up (negative CPED).
Review Questions
- What does a negative CPED indicate?
- If CPED for Good X and Y is 0.8, what is their relationship?
6. Income Elasticity of Demand (IED)
Definition and Formula
Income elasticity of demand (IED) measures responsiveness of quantity demanded to income changes.
Interpretations
- Positive (>0): Normal goods (necessities: 0-1; luxuries: >1).
- Negative (<0): Inferior goods (e.g., cheap staples during income rise).
- Zero: No income effect.
Calculation Example
Income rises 20%, car demand rises 30%: IED = 30%/20% = 1.5 (normal luxury). To arrive: Percentage changes; positive for normal.
Examples
- Steak (IED >1, luxury normal).
- Bus rides (IED <0, inferior as income rises, switch to cars).
Review Questions
- What does an IED of -0.4 suggest about a good?
- Calculate IED if income falls 5%, and quantity demanded rises 3%. Explain.

Leave a comment